Archive for the ‘National University of Engineerning’ Category
Dear lectors, in this post I show the results of the 3D simulation with variable axial spacing between conductors within the cable (S) and conductor diameter (d) of the inductance L per core of a 3-core cable or of three single-core cables comprises two parts, the self-inductance of the conductor and the mutual inductance with other cores, given by:
L = K + 0.2 loge (2D/d)

Dr. Jorge Luis Mírez Tarrillo
Group of Mathematical Modeling and Numerical Simulation (GMMNS). Universidad Nacional de Ingeniería. Lima, Perú.
E-mail: jmirez@uni.edu.pe
Website Personal: https://jorgemirez2002.wixsite.com/jorgemirez
Facebook http://www.facebook.com/jorgemirezperu
Linkedin https://www.linkedin.com/in/jorge-luis-mirez-tarrillo-94918423/
Scopus ID: https://www.scopus.com/authid/detail.uri?authorId=56488109800
Google Scholar: https://scholar.google.com/citations?user=_dSpp4YAAAAJ
MATLAB Group Admin in Facebook: https://www.facebook.com/groups/Matlab.Simulink.for.All
Estimados lectores de mis redes sociales, quería compartir con ustedes el hecho de estar calificado como Investigador RENACYT Nivel IV del CONCYTEC PERÚ… Nos toca en adelante la ardua labor de lograr el siguiente Nivel durante el 2024. Ardua porque se requiere tiempo, financiamiento (usualmente lo que hace más difícil desarrollar y avanzar en investigar), trabajo en equipo, recursos materiales… En fin, a seguir adelante y muchas gracias a quienes hacen y harán posible que sigamos avanzando.
Dr. Jorge Luis Mírez Tarrillo
Group of Mathematical Modeling and Numerical Simulation (GMMNS). Universidad Nacional de Ingeniería. Lima, Perú.
E-mail: jmirez@uni.edu.pe
Website Personal: https://jorgemirez2002.wixsite.com/jorgemirez
Facebook http://www.facebook.com/jorgemirezperu
Linkedin https://www.linkedin.com/in/jorge-luis-mirez-tarrillo-94918423/
Scopus ID: https://www.scopus.com/authid/detail.uri?authorId=56488109800
Google Scholar: https://scholar.google.com/citations?user=_dSpp4YAAAAJ
MATLAB Group Admin in Facebook: https://www.facebook.com/groups/Matlab.Simulink.for.All
Buenas horas con todos, quería compartir la noticia de que logré calificar como Investigador RENACYT Nivel V de Concytec Perú. Motivación para seguir investigando para el bienestar de la familia, sociedad y humanidad.

Dr. Jorge Luis Mírez Tarrillo
Group of Mathematical Modeling and Numerical Simulation (GMMNS). Universidad Nacional de Ingeniería. Lima, Perú.
E-mail: jmirez@uni.edu.pe
Website Personal: https://jorgemirez2002.wixsite.com/jorgemirez
Facebook http://www.facebook.com/jorgemirezperu
Linkedin https://www.linkedin.com/in/jorge-luis-mirez-tarrillo-94918423/
Scopus ID: https://www.scopus.com/authid/detail.uri?authorId=56488109800
Google Scholar: https://scholar.google.com/citations?user=_dSpp4YAAAAJ
MATLAB Group Admin in Facebook: https://www.facebook.com/groups/Matlab.Simulink.for.All
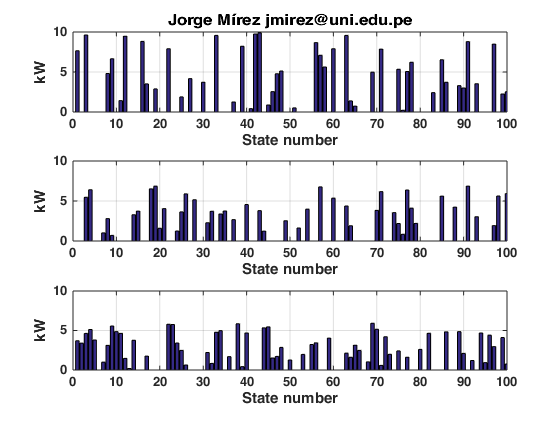
En el mundo de las energías renovables, las microrredes surgen como elementos organizativos de diferentes fuentes y cargas ubicados dentro de un espacio geográfico delimitado y con uno o más puntos de interconexión sea con otra microrred o con la red eléctrica pública. Paneles solares fotovoltaicos, turbinass eólicas, almacenamiento electroquímico, etc. son parte de sus componentes. La demanda igualmente puede ser residencial, comercial o industrial. Todo esto crea comportamiento de la demanda que es atendido por la oferta y en algún momento pueda haber déficil o sobrante. La figura del presente post muestra un ejemplo acerca de ello, en que tres microrredes debido a sus comportamientos propios, presentan diferente necesidad y sobrante en el tiempo. Hecho con MATLAB.
Dr. Jorge Luis Mírez Tarrillo – PERU
Página web: https://jorgemirez2002.wixsite.com/jorgemirez
Facebook http://www.facebook.com/jorgemirezperu
Linkedin https://www.linkedin.com/in/jorge-luis-mirez-tarrillo-94918423/
Scopus ID: https://www.scopus.com/authid/detail.uri?authorId=56488109800
Google Scholar: https://scholar.google.com/citations?user=_dSpp4YAAAAJ
Administrador de Grupo MATLAB en Facebook: https://www.facebook.com/groups/Matlab.Simulink.for.All
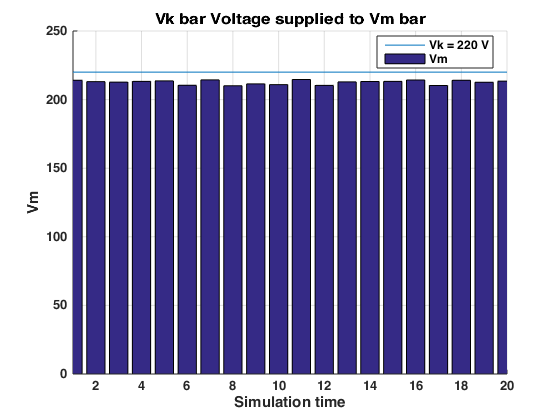
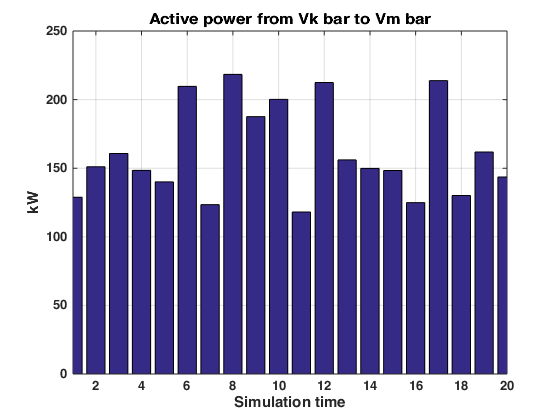
En una configuración de dos barras en DC, la diferencia de voltaje determina la cantidad de energía que fluye por unidad de tiempo, se llama potencia eléctrica, y; que en las dos gráficas del presente post se puede apreciar. En una se observa la diferencia de voltaje considerando la barra fuente con voltaje constante, usualmente asociado a su conexión con un gran sistema eléctrica de potencia o por la autoregulación de voltaje de una fuente. En la otra gráfica, el flujo de potencia eléctrica producido por esa la diferencia de voltaje respectiva. Hecho en MATLAB, con generación de números aleatorios, para lo que vengo investigando que con las DC Microgrids.
Dr. Jorge Luis Mírez Tarrillo – PERU
Facebook http://www.facebook.com/jorgemirezperu
Linkedin https://www.linkedin.com/in/jorge-luis-mirez-tarrillo-94918423/
Scopus ID: https://www.scopus.com/authid/detail.uri?authorId=56488109800
Google Scholar: https://scholar.google.com/citations?user=_dSpp4YAAAAJ
E-mail: jmirez@uni.edu.pe
Estimados lectores, y resulta que una de las cosas más interesantes es acercarse hacia las condiciones reales de velocidad de viento y de potencia, sea para la valorización energética sino para también probar los sistemas de respaldo y de control ante escenarios recreados en computadora. La gráfica desarrollado muestra las variaciones de velocidad de viento y de potencia. Hecho en MATLAB, en el que detrás hay obviamente matemáticos con generación de números aleatorios entre 4 m/s a 15 m/s., Sólo está contemplado una turbina con densidad de aire y coeficiente de potencia constante, pero se puede recrear escenarios más reales. Bienvenido el apoyo y colaboración para seguir investigando y publicando.

Dr. Jorge Luis Mírez Tarrillo – PERU
Facebook http://www.facebook.com/jorgemirezperu
Linkedin https://www.linkedin.com/in/jorge-luis-mirez-tarrillo-94918423/
Scopus ID: https://www.scopus.com/authid/detail.uri?authorId=56488109800
Google Scholar: https://scholar.google.com/citations?user=_dSpp4YAAAAJ
E-mail: jmirez@uni.edu.pe
Todo artefacto, componente, máquina, sistema, etc… presenta un progresivo envejecimiento que conlleva a la falla de los equipos los cuales se van registrando durante los años de funcionamiento y con esa información se crea histogramas como el que se muestra en el presente post. Obviamente mientras más fallas se presentan la curva de distribución se forma mejor, y a partir de ello se puede normalizar y tener una función de probabilidad característica de la marca y modelo del equipo, máquina, etc. Elaborado con MATLAB para ustedes queda la gráfica.

Dr. Jorge Luis Mírez Tarrillo – PERU
Facebook http://www.facebook.com/jorgemirezperu
Linkedin https://www.linkedin.com/in/jorge-luis-mirez-tarrillo-94918423/
Scopus ID: https://www.scopus.com/authid/detail.uri?authorId=56488109800
Google Scholar: https://scholar.google.com/citations?user=_dSpp4YAAAAJ
E-mail: jmirez@uni.edu.pe
Invitación a participar del Webinar: Microrredes Eléctricas. Expositor: Dr. Jorge Mírez. Jueves 30 de Marzo 2023. Hora: 16:00 horas México (17:00 horas Lima)
Link de Registro Expo Energía México 2023:
https://www.expoenergia.com.mx/Webinar/index.php

Link in IEEExplore: https://ieeexplore.ieee.org/document/9140175
DOI: 10.1109/ICMEAE.2019.00034
Abstract:
This article includes a compilation and analysis of relevant information on the state of the art of the implementation of the Droop Control technique in microgrids. To this end, a summary and compilation of the theoretical models of the Droop Control and a summary of implementations have been made and, in general, try to summarize the great variety of experiences developed in this topic. The chosen experiences have been selected according to the research motivations that are available in the future and that are explained throughout this article, since this will serve as a starting point and guide for future research in microgrids and similar novel topics such as Low Voltage Distribution in Direct Current (LV DC) and DC microgrids (DC MG). The LV DC distribution for this article is related to houses in direct current (DC Home).
Gratefully for this news !!
Regards:
Dr. Jorge Luis Mírez Tarrillo – PERU
Facebook http://www.facebook.com/jorgemirezperu
Linkedin https://www.linkedin.com/in/jorge-luis-mirez-tarrillo-94918423/
E-mail: jmirez@uni.edu.pe
Determining the necessary area of photovoltaic solar panels to be able to feed a demand is something to evaluate considering that both the demand and the energy source (the Sun) vary in their behavior. The total solar cells area required to supply the load demand can be calculated from the following equation shown in the figure of this post where \F_{s} is the safety factor which includes the possible allowance of insolation data inaccuracy, \V_{F} is the factor of variability which considers the impact of yearly radiation variation. \P_{L} is the power demand, \H_{t} is the solar irradiation and \n_{c} is the efficiency of the photovoltaic solar panel.

Dr. Jorge Luis Mírez Tarrillo – PERU
Facebook http://www.facebook.com/jorgemirezperu
Linkedin https://www.linkedin.com/in/jorge-luis-mirez-tarrillo-94918423/
Scopus ID: https://www.scopus.com/authid/detail.uri?authorId=56488109800
Google Scholar: https://scholar.google.com/citations?user=_dSpp4YAAAAJ
E-mail: jmirez@uni.edu.pe
Good morning readers, solar energy is an interesting topic and knowing how efficient its capture is interesting to model and simulate. The hourly generating efficiency of the PV system (calculated in percentage) can be obtained in terms of the cell temperature as shown in the following equation shown in the figure of this post, where \beta_{t} is the temperature coefficient, μcr and \T_{cr} are the theoretical solar cell efficiency and temperature at solar radiation flux of 1000 W/m2, respectively, \lambda is the Ross coefficient, \T_{a} is the ambient temperature and \H_{t} is the solar radiation on tilted surface. Note: All the simulation images in this blog have been developed in Matlab/Simulink, the codes are for sale, as well as the thesis and research advisory service. Best regards.

Dr. Jorge Luis Mírez Tarrillo – PERU
Facebook http://www.facebook.com/jorgemirezperu
Linkedin https://www.linkedin.com/in/jorge-luis-mirez-tarrillo-94918423/
Scopus ID: https://www.scopus.com/authid/detail.uri?authorId=56488109800
Google Scholar: https://scholar.google.com/citations?user=_dSpp4YAAAAJ
E-mail: jmirez@uni.edu.pe
This post has to do with programming and simulating the power curve of a wind turbine and for example I have considered a capacity of 10 MW, with a starting speed of 3 m/s, a nominal speed of 10 m/s and a cutting speed of 25 m/s approx. The output power of wind turbine is described in terms of wind speed from the typical power curve characteristics of the windturbine as it is show in figure of the present post, where, Pw is the wind turbine output power, Pr is the rated output power of WT, u_c is the cut-in wind speed, u_r is the rated wind speed, and u_f is the cut-off wind speed.

Dr. Jorge Luis Mírez Tarrillo – PERU
Facebook http://www.facebook.com/jorgemirezperu
Linkedin https://www.linkedin.com/in/jorge-luis-mirez-tarrillo-94918423/
Scopus ID: https://www.scopus.com/authid/detail.uri?authorId=56488109800
Google Scholar: https://scholar.google.com/citations?user=_dSpp4YAAAAJ
E-mail: jmirez@uni.edu.pe
Wind resources and the electric power output from wind turbine at a particular location depend on wind speed at the hub height, the wind turbine speed characteristics. Wind speed at the hub height of wind turbine is calculated by the power law equation using the wind speed data collected at the anemometer height as the equation in figure where, u(h) and u(hg) are wind speeds at hub height (h ) and anemometer height (hg), respectively, and Greek letter alpha is the roughness factor considered as 1.0 and 1.4 for this post. In this simulation hg = 10 meters and u(hg) = 10 m/s. This simulation is the result of the implementation of the mathematical model in Matlab.


Dr. Jorge Luis Mírez Tarrillo – PERU
Facebook http://www.facebook.com/jorgemirezperu
Linkedin https://www.linkedin.com/in/jorge-luis-mirez-tarrillo-94918423/
Scopus ID: https://www.scopus.com/authid/detail.uri?authorId=56488109800
Google Scholar: https://scholar.google.com/citations?user=_dSpp4YAAAAJ
E-mail: jmirez@uni.edu.pe
Dear readers, I show you a new simulation using Matlab in the next post. The induced voltage in the coils of a transformer is related to the frequency and the magnetic flux that passes through it. These, beyond the ideal calculation of being constant values, have small variations due to multiple factors, and therefore, lead to the fact that the induced voltage naturally has a slightly variable behavior over time. These changes involve transient processes of energy flow and exchange that can be simulated with Matlab/Simulink creating the appropriate study scenarios. Share my blog. Best regards.


Dr. Jorge Luis Mírez Tarrillo – PERU
Facebook http://www.facebook.com/jorgemirezperu
Linkedin https://www.linkedin.com/in/jorge-luis-mirez-tarrillo-94918423/
Scopus ID: https://www.scopus.com/authid/detail.uri?authorId=56488109800
Google Scholar: https://scholar.google.com/citations?user=_dSpp4YAAAAJ
E-mail: jmirez@uni.edu.pe
The famous transformation ratio in a power transformer is shown to be an easy algebraic relationship to learn and understand, however, the usual voltage variations involve changes in the electromotive forces that occur inside the coils. The image shows an emulation of such changes with voltage variations within the range allowed by technical standards.


Dr. Jorge Luis Mírez Tarrillo – PERU
Facebook http://www.facebook.com/jorgemirezperu
Linkedin https://www.linkedin.com/in/jorge-luis-mirez-tarrillo-94918423/
Scopus ID: https://www.scopus.com/authid/detail.uri?authorId=56488109800
Google Scholar: https://scholar.google.com/citations?user=_dSpp4YAAAAJ
E-mail: jmirez@uni.edu.pe
Anuncio publicitario
En el presente video modelamos la potencia de la turbina eólica considerando la variación del área de barrido y la velocidad del viento, además, densidad y coeficiente de potencia se toman como constantes. Hecho en Matlab y 100 % práctico. Invitados a inscribirse en mi canal y seguirme en mis redes sociales.
Dr. Jorge Luis Mírez Tarrillo – PERU
Facebook http://www.facebook.com/jorgemirezperu
Linkedin https://www.linkedin.com/in/jorge-luis-mirez-tarrillo-94918423/
Scopus ID: https://www.scopus.com/authid/detail.uri?authorId=56488109800
Google Scholar: https://scholar.google.com/citations?user=_dSpp4YAAAAJ
E-mail: jmirez@uni.edu.pe
ESPOCH 50 años ‘Congreso Internacional ESPOCH 50 años’. Un espacio de investigación con expositores de todo el mundo.
Expositor: Dr. Jorge Luis Mírez Tarrillo
Tema: Microrredes Eléctricas
Institución: Universidad Nacional de Ingeniería, Lima, Perú.
https://fb.watch/cGlrOoPc9s/
Dr. Jorge Luis Mírez Tarrillo – PERU
Facebook http://www.facebook.com/jorgemirezperu
Linkedin https://www.linkedin.com/in/jorge-luis-mirez-tarrillo-94918423/
Scopus ID: https://www.scopus.com/authid/detail.uri?authorId=56488109800
Google Scholar: https://scholar.google.com/citations?user=_dSpp4YAAAAJ
E-mail: jmirez@uni.edu.pe
Estimados lectores. Han pasado 10 años desde que vine por primera vez a la ESPOCH – Escuela Politécnica del Chimborazo en Riobamba, Ecuador. En aquel momento era un estudiante que iniciaba sus estudios de doctorado en física con el ánimo de aportar a lo que ahora es redes eléctricas inteligentes o avanzadas y energías renovables. Ahora, 2022, participo gracias a la invitación de la Facultad de Ciencias de la ESPOCH de las actividades de celebración por los 50 años de Fundación de esta universidad, y es muy grato nuevamente recorrer sus ambientes, re-encontrarme con los amigos que nunca perdimos la comunicación a pesar de la distancia y conocer nuevos colegas, estudiantes y acordar los trabajos de colaboración a futuro. De hecho me toca hacer una exposición y será éste miércoles a las 2:30 pm con el tema: Microrredes Eléctricas Inteligentes… y ésta será un resumen de lo recorrido, de los conceptos básicos, los aportes en la operación, control, optimización, así como la experiencia de modelar matemáticamente las microrredes y sus componentes y de hacer simulación numérica, e ideas concepto y visión de nuevos trabajos; todo esto expuesto en base a las publicaciones Scopus hechas en estos años. Siento que la vida me trae por acá para una pausa en el ajetreo diario y nuevamente interactuar y ver en la labor académica, el motivo de vida que más mejores resultados me ha dado en la vida junto con la familia. Es momento de reactivas blogs, redes sociales y nuevamente centrarme en usar mis conocimientos para la investigación ahora ya abordando redes eléctricas inteligentes, ingeniería biomédica, ingeniería aeroespacial, ingeniería inversa de culturas incas y preincas y hay mucho material borrador que la vida y sus circunstancias hizo que deje de atender, pero es momento de retornar. Gracias a las instituciones, universidades, colegas, amigos y familiares que siempre apoyan, todos en su momento como arte de magia salen al encuentro en el camino de la vida. Gracias ESPOCH, Riobamba y Ecuador, en especial al Dr. Celso Recalde y su equipo de la Facultad de Ciencias. Atentamente: ING. Jorge Luis Mírez Tarrillo.

Dr. Jorge Luis Mírez Tarrillo – PERU
Facebook http://www.facebook.com/jorgemirezperu
Linkedin https://www.linkedin.com/in/jorge-luis-mirez-tarrillo-94918423/
Scopus ID: https://www.scopus.com/authid/detail.uri?authorId=56488109800
Google Scholar: https://scholar.google.com/citations?user=_dSpp4YAAAAJ
E-mail: jmirez@uni.edu.pe
Dear readers, in the large cities and interurban spaces increasingly populated by the increase in the world population, it will be possible in the near future – if it does not exist now – to be able to configure the electrical loads in sets of multi-nanogrids. and / or multi-microgrids. All of them can have their own storage or have a storage for all of them. The figure, shows that I have been able to model and simulate the behavior of the energy stored in a storage source that collects or supplies energy to all nanogrids and / or microgrids. Its importance lies in sharing the surpluses to supply those that lack energy. If there is surplus, then know how much value they can get. If there is a deficit between all of them, the energy purchase will be made. Here they enter to carve different types of technologies between power electronics, control and protection systems. Random behavior has been considered anyway, as it is what happens in real life. While this is all mathematical modeling and numerical simulation, real data can be added. I hope it is of interest to you and I leave my contact information at the signing of this post. Regards.

Jorge Luis Mírez Tarrillo [Jorge Mírez]
Mechanical Electrica Eng.; MSc & Dr. Physics.
Linkedin https://www.linkedin.com/in/jorge-luis-mirez-tarrillo-94918423/
Facebook http://www.facebook.com/jorgemirezperu
Author Scopus https://www.scopus.com/authid/detail.uri?authorId=56488109800
E-mail: jmirez@uni.edu.pe
Lima, Peru
Dear readers, I am grateful for the multiple visits each day to my different blogs. On the subject of renewable energies, there are concepts such as microgrids (a cell with the ability to connect and disconnect from the Public Electricity Grid (PEG) through a Common Coupling Point with a capacity of up to 10 MW) and nanogrids (a unit of Generally a small residential and / or commercial load equipped with renewable sources such as photovoltaic solar panels, wind turbines or others plus a storage system. Nanogrids and microgrids must work with other similar ones in a coordinated way and sharing resources that they have surplus to Some, transfer it to others. With this, in front of the PEG, the microgrids / nanogrids arrangements that we will call multi-nanogrids – multi-microgrids must present a global balance of excess or missing power of all. The image of this post shows an axis of states – to generalize – how the deficit and surplus of the power that houses the entire set of multi-nanogrids – mult i-microgrids. I hope it is of interest to you and I leave my contact information at the signing of this post. Regards.

Jorge Luis Mírez Tarrillo [Jorge Mírez]
Mechanical Electrica Eng.; MSc & Dr. Physics.
Linkedin https://www.linkedin.com/in/jorge-luis-mirez-tarrillo-94918423/
Facebook http://www.facebook.com/jorgemirezperu
Author Scopus https://www.scopus.com/authid/detail.uri?authorId=56488109800
E-mail: jmirez@uni.edu.pe
Lima, Peru
Blog in ENGLISH

Compra/Buy – Haz una donación/Make a donation

Dear reader, if you wish to make a donation or are interested in any information or code, please contact me (e-mail: jmirez@uni.edu.pe). Donations will allow you to continue studying and researching, and also to provide more information on this blog. My PayPal account is jorgemirez2002@gmail.com or if it is by bank transfer write to my email jmirez@uni.edu.pe. Any amount of money is welcome. Thank you.
Estimado lector, si desean hacer una donación o le interesa alguna información o código, favor ponerse en contacto con mi persona (e-mail: jmirez@uni.edu.pe). Las donaciones va a permitir seguir estudiando e investigando, y además, el poder brindar más información en este blog. Mi cuenta en PayPal es jorgemirez2002@gmail.com o si es por transferencia bancaria escribirme a mi correo jmirez@uni.edu.pe. Cualquier cantidad de dinero es bienvenido. Gracias.
Datos Generales
Good day. My full name is Jorge Luis MIREZ TARRILLO.
I am Peruvian and live in Lima, capital of Perú in South America.I am Mechanical Electrical Engineering, MSc Physics and Dr. Physics (title doctoral thesis: Control, Optimization, and Management of Microgrid Current Direct)
Too, actually job as Principal Professor in Faculty of Oil, Gas and Petrochemical Engineering of Universidad Nacional de Ingeniería (National University of Engineering) in Lima – PERU (Courses: Modern Physics, Differential Equations and Research's Methodology)
My subjects of my interest are control, signal processing, optimization, simulation, biomedical research, smart grid, microgrid, water.
I have experience in Matlab/Simulink programming, biomedical equipment, electrical systems, renewable energies, microgrids, saturated steam systems 100 psi and organizing academic events.
Comentarios Recientes
Elementos que compon… en J506: Los elementos de un paqu… Dr. Jorge Mírez en Message by IEEE Community Dr. Jorge Mírez en J546: Simulación de campos mag… jose luis huayanay v… en Message by IEEE Community Cesar Aviles en J546: Simulación de campos mag… Dr. Jorge Mírez en J518: La herramienta pdetool d… Dr. Jorge Mírez en J496: Simulación en Matlab/Sim… Raúl Barrios Elizarr… en J496: Simulación en Matlab/Sim… jose luis huayanay v… en J518: La herramienta pdetool d… MSc. Jorge Mírez en J281: La Rosa de Vientos: Frec…

Debe estar conectado para enviar un comentario.