Archive for the ‘Wind Turbine’ Category
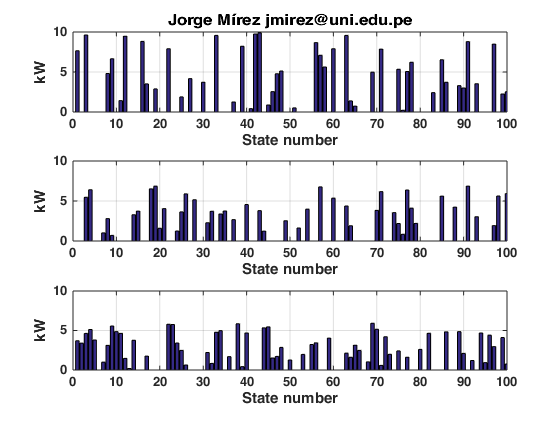
En el mundo de las energías renovables, las microrredes surgen como elementos organizativos de diferentes fuentes y cargas ubicados dentro de un espacio geográfico delimitado y con uno o más puntos de interconexión sea con otra microrred o con la red eléctrica pública. Paneles solares fotovoltaicos, turbinass eólicas, almacenamiento electroquímico, etc. son parte de sus componentes. La demanda igualmente puede ser residencial, comercial o industrial. Todo esto crea comportamiento de la demanda que es atendido por la oferta y en algún momento pueda haber déficil o sobrante. La figura del presente post muestra un ejemplo acerca de ello, en que tres microrredes debido a sus comportamientos propios, presentan diferente necesidad y sobrante en el tiempo. Hecho con MATLAB.
Dr. Jorge Luis Mírez Tarrillo – PERU
Página web: https://jorgemirez2002.wixsite.com/jorgemirez
Facebook http://www.facebook.com/jorgemirezperu
Linkedin https://www.linkedin.com/in/jorge-luis-mirez-tarrillo-94918423/
Scopus ID: https://www.scopus.com/authid/detail.uri?authorId=56488109800
Google Scholar: https://scholar.google.com/citations?user=_dSpp4YAAAAJ
Administrador de Grupo MATLAB en Facebook: https://www.facebook.com/groups/Matlab.Simulink.for.All
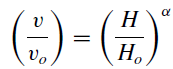
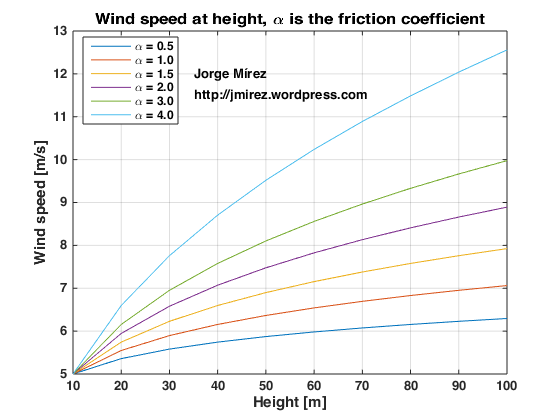
Wind speed will increase with the height because the friction at earth surface is large. The rate of the increase of wind speed that is often used to characterize the impact of the roughness of the earth’s surface on wind speed is given by the equation of this post, where v is the wind speed at height H, vo is the nominal wind speed at height Ho, and α is the friction coefficient. Made with MATLAB.
Dr. Jorge Luis Mírez Tarrillo – PERU
Página web: https://jorgemirez2002.wixsite.com/jorgemirez
Facebook http://www.facebook.com/jorgemirezperu
Linkedin https://www.linkedin.com/in/jorge-luis-mirez-tarrillo-94918423/
Scopus ID: https://www.scopus.com/authid/detail.uri?authorId=56488109800
Google Scholar: https://scholar.google.com/citations?user=_dSpp4YAAAAJ
Administrador de Grupo MATLAB en Facebook: https://www.facebook.com/groups/Matlab.Simulink.for.All
Estimados lectores, y resulta que una de las cosas más interesantes es acercarse hacia las condiciones reales de velocidad de viento y de potencia, sea para la valorización energética sino para también probar los sistemas de respaldo y de control ante escenarios recreados en computadora. La gráfica desarrollado muestra las variaciones de velocidad de viento y de potencia. Hecho en MATLAB, en el que detrás hay obviamente matemáticos con generación de números aleatorios entre 4 m/s a 15 m/s., Sólo está contemplado una turbina con densidad de aire y coeficiente de potencia constante, pero se puede recrear escenarios más reales. Bienvenido el apoyo y colaboración para seguir investigando y publicando.

Dr. Jorge Luis Mírez Tarrillo – PERU
Facebook http://www.facebook.com/jorgemirezperu
Linkedin https://www.linkedin.com/in/jorge-luis-mirez-tarrillo-94918423/
Scopus ID: https://www.scopus.com/authid/detail.uri?authorId=56488109800
Google Scholar: https://scholar.google.com/citations?user=_dSpp4YAAAAJ
E-mail: jmirez@uni.edu.pe
Estimados lectores, lo que considero relevante es al admirar el plano es ver que el punto que marca la potencia ideal de una turbina eólica realizaría una trayectoria sobre esa superficie que en éste caso toma constante el valor de la densidad y del coeficiente de potencia. Hecho en MATLAB. Bienvenido todo apoyo y colaboración para continuar investigando.

Dr. Jorge Luis Mírez Tarrillo – PERU
Facebook http://www.facebook.com/jorgemirezperu
Linkedin https://www.linkedin.com/in/jorge-luis-mirez-tarrillo-94918423/
Scopus ID: https://www.scopus.com/authid/detail.uri?authorId=56488109800
Google Scholar: https://scholar.google.com/citations?user=_dSpp4YAAAAJ
E-mail: jmirez@uni.edu.pe
Todo artefacto, componente, máquina, sistema, etc… presenta un progresivo envejecimiento que conlleva a la falla de los equipos los cuales se van registrando durante los años de funcionamiento y con esa información se crea histogramas como el que se muestra en el presente post. Obviamente mientras más fallas se presentan la curva de distribución se forma mejor, y a partir de ello se puede normalizar y tener una función de probabilidad característica de la marca y modelo del equipo, máquina, etc. Elaborado con MATLAB para ustedes queda la gráfica.

Dr. Jorge Luis Mírez Tarrillo – PERU
Facebook http://www.facebook.com/jorgemirezperu
Linkedin https://www.linkedin.com/in/jorge-luis-mirez-tarrillo-94918423/
Scopus ID: https://www.scopus.com/authid/detail.uri?authorId=56488109800
Google Scholar: https://scholar.google.com/citations?user=_dSpp4YAAAAJ
E-mail: jmirez@uni.edu.pe
Invitación a participar del Webinar: Microrredes Eléctricas. Expositor: Dr. Jorge Mírez. Jueves 30 de Marzo 2023. Hora: 16:00 horas México (17:00 horas Lima)
Link de Registro Expo Energía México 2023:
https://www.expoenergia.com.mx/Webinar/index.php

Link in IEEExplore: https://ieeexplore.ieee.org/document/9140175
DOI: 10.1109/ICMEAE.2019.00034
Abstract:
This article includes a compilation and analysis of relevant information on the state of the art of the implementation of the Droop Control technique in microgrids. To this end, a summary and compilation of the theoretical models of the Droop Control and a summary of implementations have been made and, in general, try to summarize the great variety of experiences developed in this topic. The chosen experiences have been selected according to the research motivations that are available in the future and that are explained throughout this article, since this will serve as a starting point and guide for future research in microgrids and similar novel topics such as Low Voltage Distribution in Direct Current (LV DC) and DC microgrids (DC MG). The LV DC distribution for this article is related to houses in direct current (DC Home).
Gratefully for this news !!
Regards:
Dr. Jorge Luis Mírez Tarrillo – PERU
Facebook http://www.facebook.com/jorgemirezperu
Linkedin https://www.linkedin.com/in/jorge-luis-mirez-tarrillo-94918423/
E-mail: jmirez@uni.edu.pe
This post has to do with programming and simulating the power curve of a wind turbine and for example I have considered a capacity of 10 MW, with a starting speed of 3 m/s, a nominal speed of 10 m/s and a cutting speed of 25 m/s approx. The output power of wind turbine is described in terms of wind speed from the typical power curve characteristics of the windturbine as it is show in figure of the present post, where, Pw is the wind turbine output power, Pr is the rated output power of WT, u_c is the cut-in wind speed, u_r is the rated wind speed, and u_f is the cut-off wind speed.

Dr. Jorge Luis Mírez Tarrillo – PERU
Facebook http://www.facebook.com/jorgemirezperu
Linkedin https://www.linkedin.com/in/jorge-luis-mirez-tarrillo-94918423/
Scopus ID: https://www.scopus.com/authid/detail.uri?authorId=56488109800
Google Scholar: https://scholar.google.com/citations?user=_dSpp4YAAAAJ
E-mail: jmirez@uni.edu.pe
Wind resources and the electric power output from wind turbine at a particular location depend on wind speed at the hub height, the wind turbine speed characteristics. Wind speed at the hub height of wind turbine is calculated by the power law equation using the wind speed data collected at the anemometer height as the equation in figure where, u(h) and u(hg) are wind speeds at hub height (h ) and anemometer height (hg), respectively, and Greek letter alpha is the roughness factor considered as 1.0 and 1.4 for this post. In this simulation hg = 10 meters and u(hg) = 10 m/s. This simulation is the result of the implementation of the mathematical model in Matlab.


Dr. Jorge Luis Mírez Tarrillo – PERU
Facebook http://www.facebook.com/jorgemirezperu
Linkedin https://www.linkedin.com/in/jorge-luis-mirez-tarrillo-94918423/
Scopus ID: https://www.scopus.com/authid/detail.uri?authorId=56488109800
Google Scholar: https://scholar.google.com/citations?user=_dSpp4YAAAAJ
E-mail: jmirez@uni.edu.pe
En el presente video modelamos la potencia de la turbina eólica considerando la variación del área de barrido y la velocidad del viento, además, densidad y coeficiente de potencia se toman como constantes. Hecho en Matlab y 100 % práctico. Invitados a inscribirse en mi canal y seguirme en mis redes sociales.
Dr. Jorge Luis Mírez Tarrillo – PERU
Facebook http://www.facebook.com/jorgemirezperu
Linkedin https://www.linkedin.com/in/jorge-luis-mirez-tarrillo-94918423/
Scopus ID: https://www.scopus.com/authid/detail.uri?authorId=56488109800
Google Scholar: https://scholar.google.com/citations?user=_dSpp4YAAAAJ
E-mail: jmirez@uni.edu.pe
ESPOCH 50 años ‘Congreso Internacional ESPOCH 50 años’. Un espacio de investigación con expositores de todo el mundo.
Expositor: Dr. Jorge Luis Mírez Tarrillo
Tema: Microrredes Eléctricas
Institución: Universidad Nacional de Ingeniería, Lima, Perú.
https://fb.watch/cGlrOoPc9s/
Dr. Jorge Luis Mírez Tarrillo – PERU
Facebook http://www.facebook.com/jorgemirezperu
Linkedin https://www.linkedin.com/in/jorge-luis-mirez-tarrillo-94918423/
Scopus ID: https://www.scopus.com/authid/detail.uri?authorId=56488109800
Google Scholar: https://scholar.google.com/citations?user=_dSpp4YAAAAJ
E-mail: jmirez@uni.edu.pe
Estimados lectores. Han pasado 10 años desde que vine por primera vez a la ESPOCH – Escuela Politécnica del Chimborazo en Riobamba, Ecuador. En aquel momento era un estudiante que iniciaba sus estudios de doctorado en física con el ánimo de aportar a lo que ahora es redes eléctricas inteligentes o avanzadas y energías renovables. Ahora, 2022, participo gracias a la invitación de la Facultad de Ciencias de la ESPOCH de las actividades de celebración por los 50 años de Fundación de esta universidad, y es muy grato nuevamente recorrer sus ambientes, re-encontrarme con los amigos que nunca perdimos la comunicación a pesar de la distancia y conocer nuevos colegas, estudiantes y acordar los trabajos de colaboración a futuro. De hecho me toca hacer una exposición y será éste miércoles a las 2:30 pm con el tema: Microrredes Eléctricas Inteligentes… y ésta será un resumen de lo recorrido, de los conceptos básicos, los aportes en la operación, control, optimización, así como la experiencia de modelar matemáticamente las microrredes y sus componentes y de hacer simulación numérica, e ideas concepto y visión de nuevos trabajos; todo esto expuesto en base a las publicaciones Scopus hechas en estos años. Siento que la vida me trae por acá para una pausa en el ajetreo diario y nuevamente interactuar y ver en la labor académica, el motivo de vida que más mejores resultados me ha dado en la vida junto con la familia. Es momento de reactivas blogs, redes sociales y nuevamente centrarme en usar mis conocimientos para la investigación ahora ya abordando redes eléctricas inteligentes, ingeniería biomédica, ingeniería aeroespacial, ingeniería inversa de culturas incas y preincas y hay mucho material borrador que la vida y sus circunstancias hizo que deje de atender, pero es momento de retornar. Gracias a las instituciones, universidades, colegas, amigos y familiares que siempre apoyan, todos en su momento como arte de magia salen al encuentro en el camino de la vida. Gracias ESPOCH, Riobamba y Ecuador, en especial al Dr. Celso Recalde y su equipo de la Facultad de Ciencias. Atentamente: ING. Jorge Luis Mírez Tarrillo.

Dr. Jorge Luis Mírez Tarrillo – PERU
Facebook http://www.facebook.com/jorgemirezperu
Linkedin https://www.linkedin.com/in/jorge-luis-mirez-tarrillo-94918423/
Scopus ID: https://www.scopus.com/authid/detail.uri?authorId=56488109800
Google Scholar: https://scholar.google.com/citations?user=_dSpp4YAAAAJ
E-mail: jmirez@uni.edu.pe
Dear readers, in the large cities and interurban spaces increasingly populated by the increase in the world population, it will be possible in the near future – if it does not exist now – to be able to configure the electrical loads in sets of multi-nanogrids. and / or multi-microgrids. All of them can have their own storage or have a storage for all of them. The figure, shows that I have been able to model and simulate the behavior of the energy stored in a storage source that collects or supplies energy to all nanogrids and / or microgrids. Its importance lies in sharing the surpluses to supply those that lack energy. If there is surplus, then know how much value they can get. If there is a deficit between all of them, the energy purchase will be made. Here they enter to carve different types of technologies between power electronics, control and protection systems. Random behavior has been considered anyway, as it is what happens in real life. While this is all mathematical modeling and numerical simulation, real data can be added. I hope it is of interest to you and I leave my contact information at the signing of this post. Regards.

Jorge Luis Mírez Tarrillo [Jorge Mírez]
Mechanical Electrica Eng.; MSc & Dr. Physics.
Linkedin https://www.linkedin.com/in/jorge-luis-mirez-tarrillo-94918423/
Facebook http://www.facebook.com/jorgemirezperu
Author Scopus https://www.scopus.com/authid/detail.uri?authorId=56488109800
E-mail: jmirez@uni.edu.pe
Lima, Peru
Offshore wind has emerged as one of the most dynamic technologies in the energy system. For the first time in 2010 global capacity additions of offshore wind surpassed 1 gigawatt (GW). In 2018, a total of 4.3 GW of new offshore wind capacity was completed (see Figure). From 3 GW of offshore wind in operation in 2010, installed capacity expanded to
23 GW in 2018. Annual deployment has increased by nearly 30 % per year, higher than any other source of electricity except solar photovoltaics (PV). By mid-2019, there were over 5,500 offshore turbines connected to a grid in 17 countries. Policy support has been fundamental to this expansion, including through technology-specific capacity tenders, progress on including offshore wind in marine planning, financial support and regulatory efforts to support grid development.
The growth of the offshore wind industry has been fostered in European countries bordering the North Seas, where high quality wind resources and relatively shallow water have provided exceptionally good conditions in which to develop offshore wind technologies and bring them to market. Stable policies supported nearly 17 GW of offshore
wind capacity additions in Europe between 2010 and 2018. The United Kingdom, Germany, Belgium, Netherlands and Denmark together added 2.7 GW of capacity in 2018 alone. China has recently taken strides forward on offshore wind and now stands among the market leaders. In 2018, China added 1.6 GW of offshore wind capacity, the most of any
country. This rapid growth has been driven by the government’s 13th Five-Year Plan, which called for 5 GW of offshore wind capacity to be completed by 2020, and for the establishment of supply chains to support further expansion thereafter.

Source: IEA Offshore Wind Outlook 2019 https://www.iea.org/
Regards:
Dr. Jorge Luis Mírez Tarrillo – PERU
Facebook http://www.facebook.com/jorgemirezperu
Linkedin https://www.linkedin.com/in/jorge-luis-mirez-tarrillo-94918423/
E-mail: jmirez@uni.edu.pe

As a wind turbine generator, a permanent magnet synchronous generator (PMSG) is used in this post. Mechanical energy is acquired from the kinetic energy of the wind through a wind turbine, and the PMSG converts this energy to electrical energy. The PMSG output is converted to DC power through a thyristor rectifier. The output power of the wind turbine is equal to the DC converted power if the losses in the generator and rectifier are negligible.
Referencia: S. M. Muyeen “Wind Energy Conversion Systems – Technology and Trends” Springer. New York. DOI 10.1007/978-1-4471-2201-2
Regards:
Dr. Jorge Luis Mírez Tarrillo – PERU
Facebook http://www.facebook.com/jorgemirezperu
Linkedin https://www.linkedin.com/in/jorge-luis-mirez-tarrillo-94918423/
E-mail: jmirez@uni.edu.pe
Como generador de turbina de viento, un generador sincrónico de imanes permanentes (PMSG) es usado en el presente post. La energía mecánica es adquirida de la energía cinética del viento a través de una turbina de viento, y el PMSG convierte ésta energía a energía eléctrica. La salida de PMSG es convertida a potencia DC a través de un rectificador de tiristores. La potencia de salida de la turbina de viento es igual a la potencia convertida DC si las pérdidas en el generador y rectificador son despreciables.
Referencia: S. M. Muyeen «Wind Energy Conversion Systems – Technology and Trends» Springer. New York. DOI 10.1007/978-1-4471-2201-2
Regards:
Dr. Jorge Luis Mírez Tarrillo – PERU
Facebook http://www.facebook.com/jorgemirezperu
Linkedin https://www.linkedin.com/in/jorge-luis-mirez-tarrillo-94918423/
E-mail: jmirez@uni.edu.pe
To illustrate how this impacts the operation of the electricity grid, consider five different levels of available electricity production from RES, as shown in Figure. Note that there is not only a capacity of power towards the storage (charging the storage) but also a capacity of power from the storage to the grid (discharging the storage). It is part of the role of the system operator to decide which of the two should be chosen at any moment in time. Some thoughts are given below, based on the supply capacity in relation to the demand.
Supply level 1. The total supply capacity, directly from renewable sources plus by discharging the storage, is not enough to cover the power demand. The result is that not all the power demand can be fulfilled. All the available storage discharging capacity will be used to limit the amount of demand that is not fulfilled.
Supply level 2. The amount of supply capacity directly from renewables is not sufficient to cover the power demand, but by using part of the discharging capacity of the storage the power demand can be supplied. The remaining storage capacity can either be saved for later use or be used to cover some of the energy demand. This will be an optimization issue, where the state of charge of the storage, the expected future demand and the expected future production from renewables will have to be considered.
Supply level 3. The amount of supply capacity directly from renewables is sufficient to cover the total power demand. The remainder can be used to supply part of the energy demand and/or to charge the storage. When there is sufficient energy in the storage, the stored energy can even be used to supply the total energy demand. The optimisation of the charging/discharging of the storage versus supplying the energy demand is one of the tasks of the system operator.
Supply level 4. The amount of supply capacity directly from renewables exceeds the sum of power demand and energy demand. In that case the total power demand will be supplied and the remainder will be used to charge the storage.
Supply level 5. The amount of supply capacity directly from renewables exceeds to sum of power demand, energy demand, and charging capacity of the storage. In that case all demand should be fulfilled and the remaining amount of renewable energy will be curtailed.

Source: Antonio Moreno-Munoz. “Large Scale Grid Integration of Renewable Energy Sources”. The Institution of Engineering and Technology. 2017.
Dr. Jorge Mírez
e-mail: jmirez@uni.edu.pe
WebSite: http://www.geocities.ws/jorgemirez/
Facebook: http://www.facebook.com/jorgemirezperu (Please Like my Fanpage)
Linkedin: https://www.linkedin.com/in/jorge-luis-mirez-tarrillo-94918423/
Para ilustrar cómo esto afecta el funcionamiento de la red eléctrica, considere cinco niveles diferentes de producción de electricidad disponible de RES, como se muestra en la Figura. Tenga en cuenta que no solo existe una capacidad de alimentación hacia el almacenamiento (carga del almacenamiento) sino también una capacidad de alimentación desde el almacenamiento a la red (descarga del almacenamiento). Es parte de la función del operador del sistema decidir cuál de los dos debe elegirse en cualquier momento. Algunas ideas se dan a continuación, en función de la capacidad de oferta en relación con la demanda.
Nivel de suministro 1. La capacidad de suministro total, directamente de fuentes renovables más descargando el almacenamiento, no es suficiente para cubrir la demanda de energía. El resultado es que no se puede satisfacer toda la demanda de energía. Toda la capacidad de descarga de almacenamiento disponible se utilizará para limitar la cantidad de demanda que no se cumple.
Nivel de suministro 2. La cantidad de capacidad de suministro directamente de las energías renovables no es suficiente para cubrir la demanda de energía, pero al usar parte de la capacidad de descarga del almacenamiento, se puede suministrar la demanda de energía. La capacidad de almacenamiento restante puede guardarse para su uso posterior o utilizarse para cubrir parte de la demanda de energía. Este será un problema de optimización, donde se tendrá que considerar el estado de carga del almacenamiento, la demanda futura esperada y la producción futura esperada de las energías renovables.
Nivel de suministro 3. La cantidad de capacidad de suministro directamente de las energías renovables es suficiente para cubrir la demanda total de energía. El resto se puede usar para abastecer parte de la demanda de energía y / o cargar el almacenamiento. Cuando hay suficiente energía en el almacenamiento, la energía almacenada puede incluso usarse para abastecer la demanda total de energía. La optimización de la carga / descarga del almacenamiento frente al suministro de la demanda de energía es una de las tareas del operador del sistema.
Nivel de suministro 4. La cantidad de capacidad de suministro directamente de las energías renovables excede la suma de la demanda de energía y la demanda de energía. En ese caso, se suministrará la demanda total de energía y el resto se usará para cargar el almacenamiento.
Nivel de suministro 5. La cantidad de capacidad de suministro directamente de las energías renovables excede a la suma de la demanda de energía, la demanda de energía y la capacidad de carga del almacenamiento. En ese caso, se debe satisfacer toda la demanda y se reducirá la cantidad restante de energía renovable.
Fuente: Antonio Moreno-Munoz. «Large Scale Grid Integration of Renewable Energy Sources». The Institution of Engineering and Technology. 2017.
Dr. Jorge Mírez
e-mail: jmirez@uni.edu.pe
WebSite: http://www.geocities.ws/jorgemirez/
Facebook: http://www.facebook.com/jorgemirezperu (Darle Me Gusta)
Linkedin: https://www.linkedin.com/in/jorge-luis-mirez-tarrillo-94918423/
«Energy Management of Distributed Resources in Microgrids». J. L. Mírez, H.R. Chamorro, C.A. Ordonez, R. Moreno. 2014 IEEE 5th Colombian Workshop on Circuits and Systems (CWCAS).
DOI: 10.1109/CWCAS.2014.6994607

«Simulation of DC Microgrid and Study of Power and Battery Charge/Discharge Management». Jorge Mírez, Luis Hernández-Callejo, Manfred Horn, Luis Miguel Bonilla. DYNA Ingeniería e Industrial. November 2017 – Volume: 92 – Pages: 673-679.
DOI: http://dx.doi.org/10.6036/8475

Blog in ENGLISH

Compra/Buy – Haz una donación/Make a donation

Dear reader, if you wish to make a donation or are interested in any information or code, please contact me (e-mail: jmirez@uni.edu.pe). Donations will allow you to continue studying and researching, and also to provide more information on this blog. My PayPal account is jorgemirez2002@gmail.com or if it is by bank transfer write to my email jmirez@uni.edu.pe. Any amount of money is welcome. Thank you.
Estimado lector, si desean hacer una donación o le interesa alguna información o código, favor ponerse en contacto con mi persona (e-mail: jmirez@uni.edu.pe). Las donaciones va a permitir seguir estudiando e investigando, y además, el poder brindar más información en este blog. Mi cuenta en PayPal es jorgemirez2002@gmail.com o si es por transferencia bancaria escribirme a mi correo jmirez@uni.edu.pe. Cualquier cantidad de dinero es bienvenido. Gracias.
Datos Generales
Good day. My full name is Jorge Luis MIREZ TARRILLO.
I am Peruvian and live in Lima, capital of Perú in South America.I am Mechanical Electrical Engineering, MSc Physics and Dr. Physics (title doctoral thesis: Control, Optimization, and Management of Microgrid Current Direct)
Too, actually job as Principal Professor in Faculty of Oil, Gas and Petrochemical Engineering of Universidad Nacional de Ingeniería (National University of Engineering) in Lima – PERU (Courses: Modern Physics, Differential Equations and Research's Methodology)
My subjects of my interest are control, signal processing, optimization, simulation, biomedical research, smart grid, microgrid, water.
I have experience in Matlab/Simulink programming, biomedical equipment, electrical systems, renewable energies, microgrids, saturated steam systems 100 psi and organizing academic events.
Comentarios Recientes
Elementos que compon… en J506: Los elementos de un paqu… Dr. Jorge Mírez en Message by IEEE Community Dr. Jorge Mírez en J546: Simulación de campos mag… jose luis huayanay v… en Message by IEEE Community Cesar Aviles en J546: Simulación de campos mag… Dr. Jorge Mírez en J518: La herramienta pdetool d… Dr. Jorge Mírez en J496: Simulación en Matlab/Sim… Raúl Barrios Elizarr… en J496: Simulación en Matlab/Sim… jose luis huayanay v… en J518: La herramienta pdetool d… MSc. Jorge Mírez en J281: La Rosa de Vientos: Frec…

Debe estar conectado para enviar un comentario.