Archive for the ‘Universidad Nacional de Ingeniería UNI’ Category
Dear lectors, in this post I show the results of the 3D simulation with variable axial spacing between conductors within the cable (S) and conductor diameter (d) of the inductance L per core of a 3-core cable or of three single-core cables comprises two parts, the self-inductance of the conductor and the mutual inductance with other cores, given by:
L = K + 0.2 loge (2D/d)

Dr. Jorge Luis Mírez Tarrillo
Group of Mathematical Modeling and Numerical Simulation (GMMNS). Universidad Nacional de Ingeniería. Lima, Perú.
E-mail: jmirez@uni.edu.pe
Website Personal: https://jorgemirez2002.wixsite.com/jorgemirez
Facebook http://www.facebook.com/jorgemirezperu
Linkedin https://www.linkedin.com/in/jorge-luis-mirez-tarrillo-94918423/
Scopus ID: https://www.scopus.com/authid/detail.uri?authorId=56488109800
Google Scholar: https://scholar.google.com/citations?user=_dSpp4YAAAAJ
MATLAB Group Admin in Facebook: https://www.facebook.com/groups/Matlab.Simulink.for.All
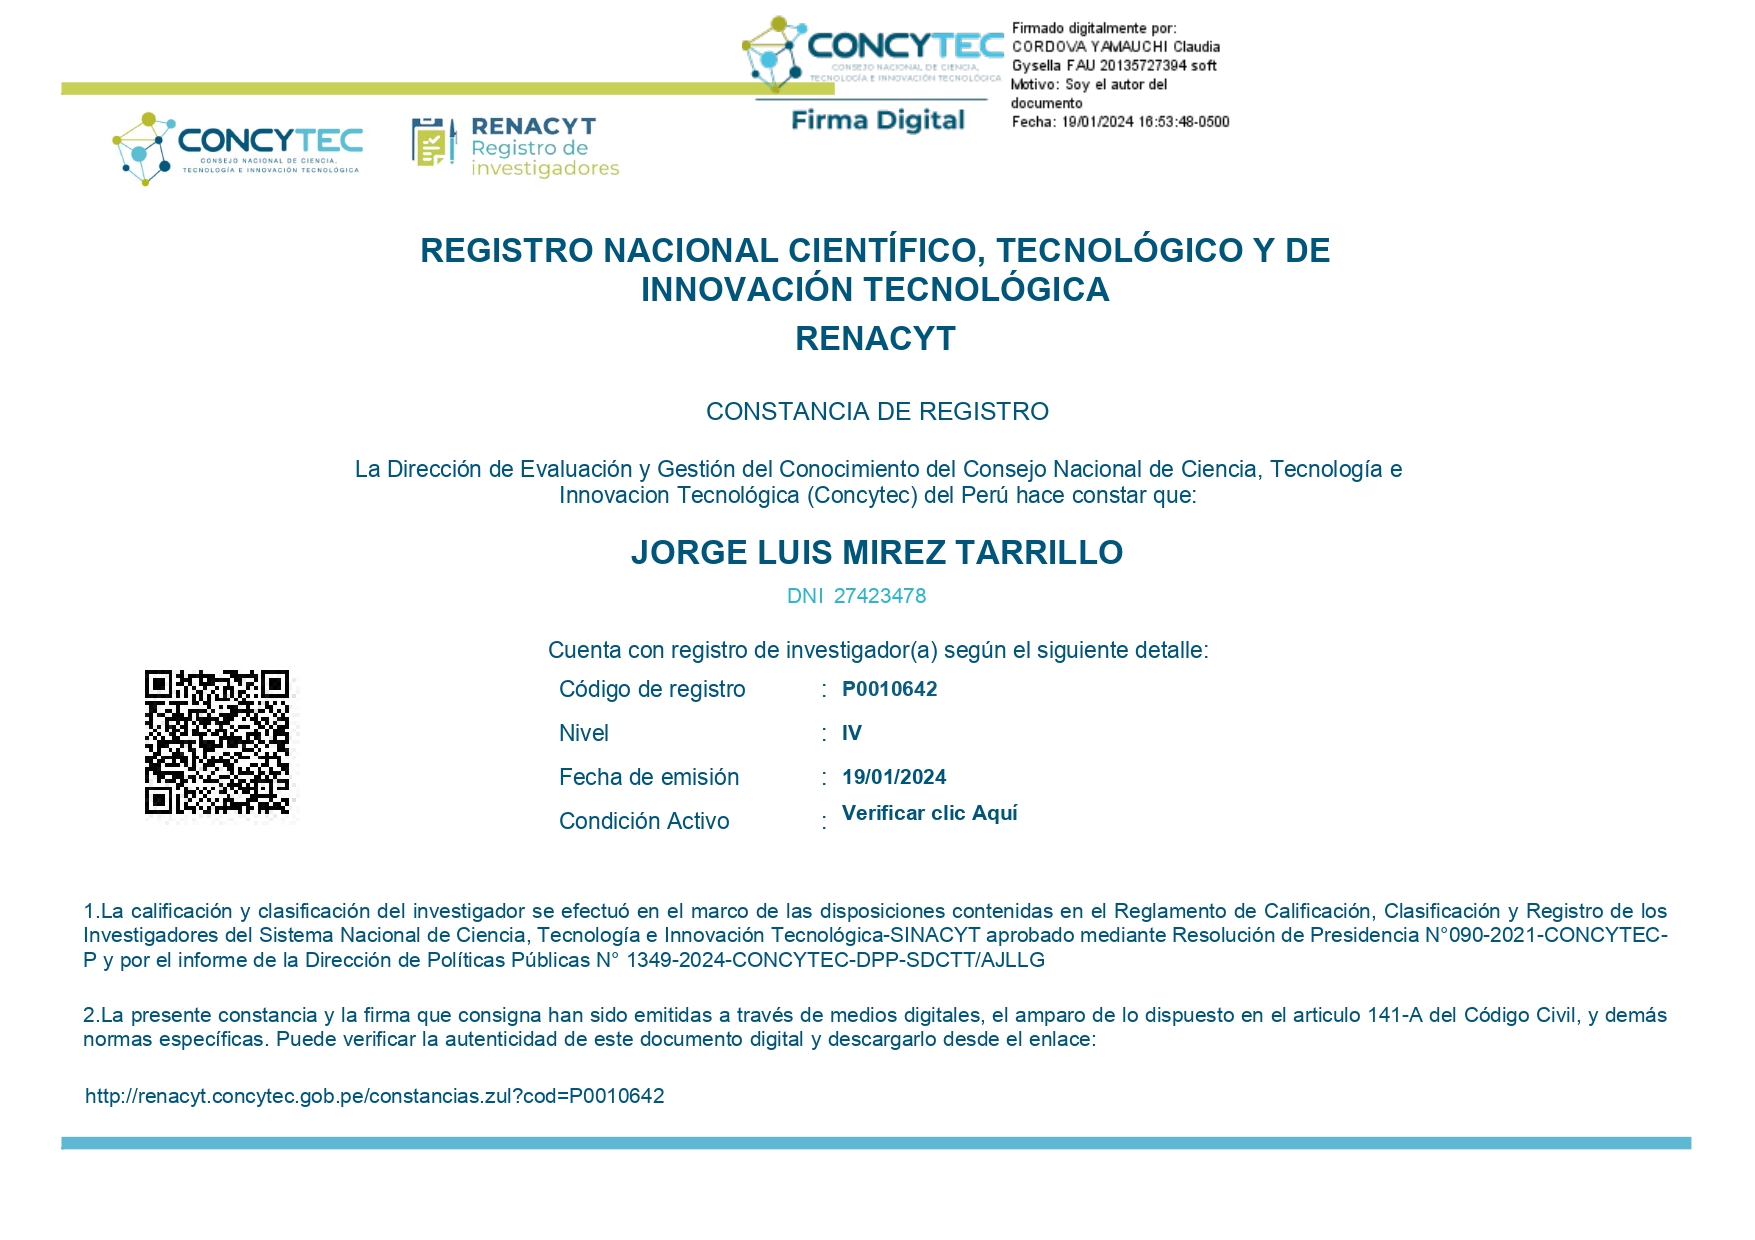
Estimados lectores de mis redes sociales, quería compartir con ustedes el hecho de estar calificado como Investigador RENACYT Nivel IV del CONCYTEC PERÚ… Nos toca en adelante la ardua labor de lograr el siguiente Nivel durante el 2024. Ardua porque se requiere tiempo, financiamiento (usualmente lo que hace más difícil desarrollar y avanzar en investigar), trabajo en equipo, recursos materiales… En fin, a seguir adelante y muchas gracias a quienes hacen y harán posible que sigamos avanzando.
Dr. Jorge Luis Mírez Tarrillo
Group of Mathematical Modeling and Numerical Simulation (GMMNS). Universidad Nacional de Ingeniería. Lima, Perú.
E-mail: jmirez@uni.edu.pe
Website Personal: https://jorgemirez2002.wixsite.com/jorgemirez
Facebook http://www.facebook.com/jorgemirezperu
Linkedin https://www.linkedin.com/in/jorge-luis-mirez-tarrillo-94918423/
Scopus ID: https://www.scopus.com/authid/detail.uri?authorId=56488109800
Google Scholar: https://scholar.google.com/citations?user=_dSpp4YAAAAJ
MATLAB Group Admin in Facebook: https://www.facebook.com/groups/Matlab.Simulink.for.All
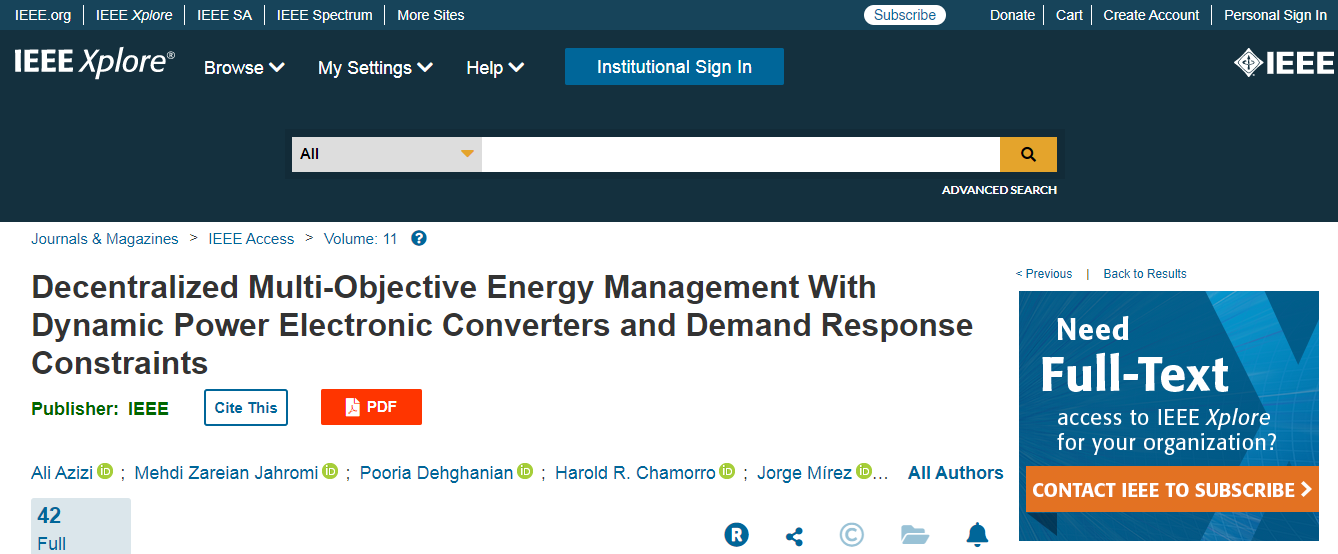
A. Azizi, M. Z. Jahromi, P. Dehghanian, H. R. Chamorro, J. Mírez and V. K. Sood, «Decentralized Multi-Objective Energy Management With Dynamic Power Electronic Converters and Demand Response Constraints,» in IEEE Access, vol. 11, pp. 146297-146312, 2023, doi: 10.1109/ACCESS.2023.3344209. keywords: {Costs;Energy management;Renewable energy sources;Power system dynamics;Voltage;Power system stability;Optimization;Demand response;Dynamic generation;demand response;renewable energy;optimization;energy management;microgrid},
https://ieeexplore.ieee.org/document/10364854
Dr. Jorge Luis Mírez Tarrillo
Group of Mathematical Modeling and Numerical Simulation (GMMNS). Universidad Nacional de Ingeniería. Lima, Perú.
E-mail: jmirez@uni.edu.pe
Website Personal: https://jorgemirez2002.wixsite.com/jorgemirez
Facebook http://www.facebook.com/jorgemirezperu
Linkedin https://www.linkedin.com/in/jorge-luis-mirez-tarrillo-94918423/
Scopus ID: https://www.scopus.com/authid/detail.uri?authorId=56488109800
Google Scholar: https://scholar.google.com/citations?user=_dSpp4YAAAAJ
MATLAB Group Admin in Facebook: https://www.facebook.com/groups/Matlab.Simulink.for.All
Buenas horas con todos, quería compartir la noticia de que logré calificar como Investigador RENACYT Nivel V de Concytec Perú. Motivación para seguir investigando para el bienestar de la familia, sociedad y humanidad.

Dr. Jorge Luis Mírez Tarrillo
Group of Mathematical Modeling and Numerical Simulation (GMMNS). Universidad Nacional de Ingeniería. Lima, Perú.
E-mail: jmirez@uni.edu.pe
Website Personal: https://jorgemirez2002.wixsite.com/jorgemirez
Facebook http://www.facebook.com/jorgemirezperu
Linkedin https://www.linkedin.com/in/jorge-luis-mirez-tarrillo-94918423/
Scopus ID: https://www.scopus.com/authid/detail.uri?authorId=56488109800
Google Scholar: https://scholar.google.com/citations?user=_dSpp4YAAAAJ
MATLAB Group Admin in Facebook: https://www.facebook.com/groups/Matlab.Simulink.for.All
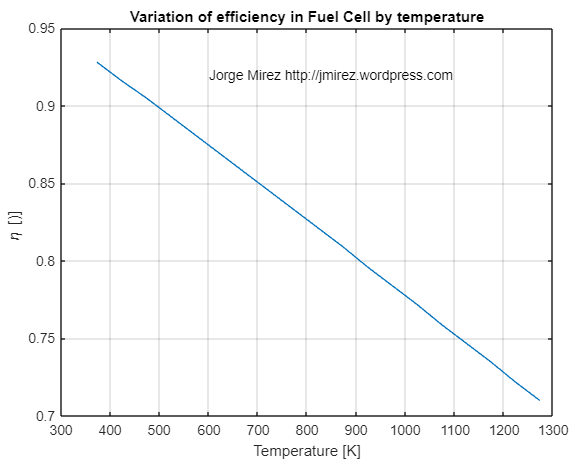
En el presente post se muestra (en figura) resultados de la simulación de como cambia el valor de la eficiencia de una celda de combustible según la temperatura. Es de mencionar que la eficiencia de una celda de combustible (FC) es la división de la energía libre de Gibbs (que es igual al trabajo de salida total) entre la energía total disponible desde la reacción electroquímica. En esto, son los procesos de conducción y convección de transferencia de calor los necesarios a usar para mantener y/o controlar la condiciones de operación de las celdas de combustible. Para la figura se ha desarrollado código MATLAB.
Dr. Jorge Luis Mírez Tarrillo
Group of Mathematical Modeling and Numerical Simulation (GMMNS).
Universidad Nacional de Ingeniería, Lima, Perú.
E-mail: jmirez@uni.edu.pe
Página web: https://jorgemirez2002.wixsite.com/jorgemirez
Facebook http://www.facebook.com/jorgemirezperu
Linkedin https://www.linkedin.com/in/jorge-luis-mirez-tarrillo-94918423/
Scopus ID: https://www.scopus.com/authid/detail.uri?authorId=56488109800
Google Scholar: https://scholar.google.com/citations?user=_dSpp4YAAAAJ
Administrador de Grupo MATLAB en Facebook: https://www.facebook.com/groups/Matlab.Simulink.for.All
This post show figure with simulation of variation of efficiency in FC. The efficiency is the relation between Gibbs free energy (that is equal to total output work) and total energy available from electrochemical reaction. Conduction and convective process of heat transfer are necessary for maintenance and/or control of the FC operation. Regads.
Dr. Jorge Luis Mírez Tarrillo
Group of Mathematical Modeling and Numerical Simulation (GMMNS).
Universidad Nacional de Ingeniería, Lima, Perú.
E-mail: jmirez@uni.edu.pe
Página web: https://jorgemirez2002.wixsite.com/jorgemirez
Facebook http://www.facebook.com/jorgemirezperu
Linkedin https://www.linkedin.com/in/jorge-luis-mirez-tarrillo-94918423/
Scopus ID: https://www.scopus.com/authid/detail.uri?authorId=56488109800
Google Scholar: https://scholar.google.com/citations?user=_dSpp4YAAAAJ
Administrador de Grupo MATLAB en Facebook: https://www.facebook.com/groups/Matlab.Simulink.for.All
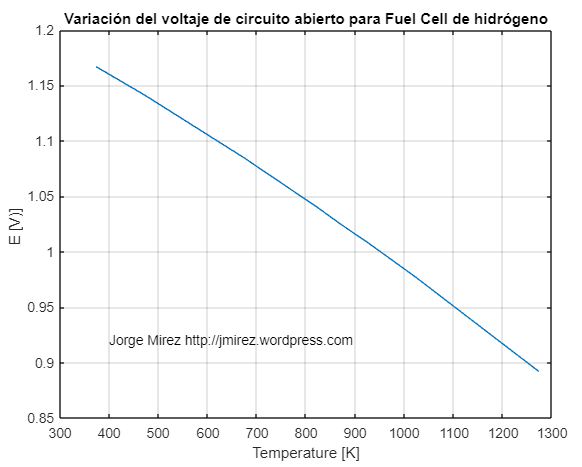
En el presente post se puede observar que la variación del voltaje de circuito abierto o voltaje teórico (OCV en inglés) de una celda de combustible que usa hidrógeno versus la temperatura. En esto está involucrado la energía libre de Gibbs, moles de electrones y la constante de Faraday. Entonces, si con la temperatura se reduce el OCV entonces conviene retirar la energía térmica, lo cual puede servir para calentar agua, calentar el aire de un ambiente y/o algún otro proceso similar. Las variaciones de temperatura operativas al tenerlos ya calculadas para todos los valores posibles, entonces es posible determinar cuando en operación la temperatura cambie y el sistema de control actúe para regular la temperatura con un mayor paso de agua, aire y/o sistemas de conducción y/o convección de calor. Simulado usando MATLAB de MathWorks Inc.
Dr. Jorge Luis Mírez Tarrillo
Group of Mathematical Modeling and Numerical Simulation (GMMNS).
Universidad Nacional de Ingeniería, Lima, Perú.
E-mail: jmirez@uni.edu.pe
Página web: https://jorgemirez2002.wixsite.com/jorgemirez
Facebook http://www.facebook.com/jorgemirezperu
Linkedin https://www.linkedin.com/in/jorge-luis-mirez-tarrillo-94918423/
Scopus ID: https://www.scopus.com/authid/detail.uri?authorId=56488109800
Google Scholar: https://scholar.google.com/citations?user=_dSpp4YAAAAJ
Administrador de Grupo MATLAB en Facebook: https://www.facebook.com/groups/Matlab.Simulink.for.All
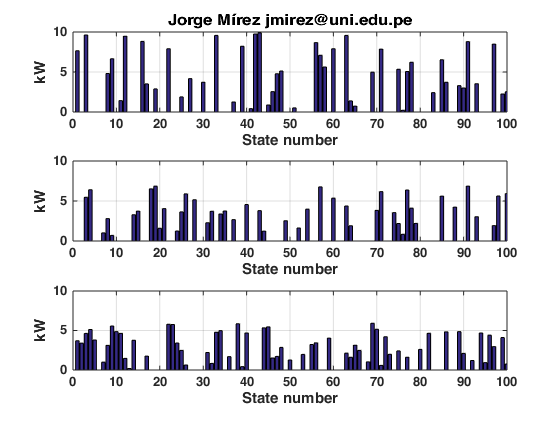
En el mundo de las energías renovables, las microrredes surgen como elementos organizativos de diferentes fuentes y cargas ubicados dentro de un espacio geográfico delimitado y con uno o más puntos de interconexión sea con otra microrred o con la red eléctrica pública. Paneles solares fotovoltaicos, turbinass eólicas, almacenamiento electroquímico, etc. son parte de sus componentes. La demanda igualmente puede ser residencial, comercial o industrial. Todo esto crea comportamiento de la demanda que es atendido por la oferta y en algún momento pueda haber déficil o sobrante. La figura del presente post muestra un ejemplo acerca de ello, en que tres microrredes debido a sus comportamientos propios, presentan diferente necesidad y sobrante en el tiempo. Hecho con MATLAB.
Dr. Jorge Luis Mírez Tarrillo – PERU
Página web: https://jorgemirez2002.wixsite.com/jorgemirez
Facebook http://www.facebook.com/jorgemirezperu
Linkedin https://www.linkedin.com/in/jorge-luis-mirez-tarrillo-94918423/
Scopus ID: https://www.scopus.com/authid/detail.uri?authorId=56488109800
Google Scholar: https://scholar.google.com/citations?user=_dSpp4YAAAAJ
Administrador de Grupo MATLAB en Facebook: https://www.facebook.com/groups/Matlab.Simulink.for.All
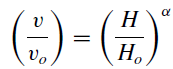
Wind speed will increase with the height because the friction at earth surface is large. The rate of the increase of wind speed that is often used to characterize the impact of the roughness of the earth’s surface on wind speed is given by the equation of this post, where v is the wind speed at height H, vo is the nominal wind speed at height Ho, and α is the friction coefficient. Made with MATLAB.
Dr. Jorge Luis Mírez Tarrillo – PERU
Página web: https://jorgemirez2002.wixsite.com/jorgemirez
Facebook http://www.facebook.com/jorgemirezperu
Linkedin https://www.linkedin.com/in/jorge-luis-mirez-tarrillo-94918423/
Scopus ID: https://www.scopus.com/authid/detail.uri?authorId=56488109800
Google Scholar: https://scholar.google.com/citations?user=_dSpp4YAAAAJ
Administrador de Grupo MATLAB en Facebook: https://www.facebook.com/groups/Matlab.Simulink.for.All
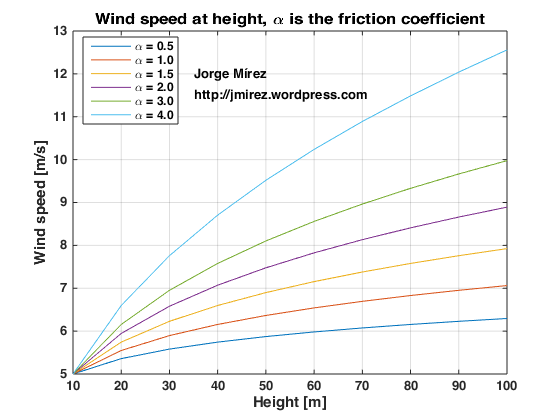
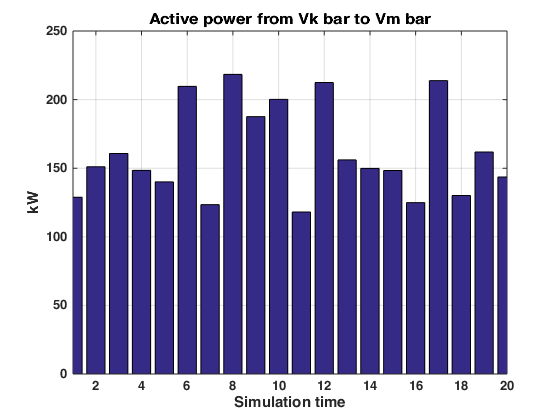
En una configuración de dos barras en DC, la diferencia de voltaje determina la cantidad de energía que fluye por unidad de tiempo, se llama potencia eléctrica, y; que en las dos gráficas del presente post se puede apreciar. En una se observa la diferencia de voltaje considerando la barra fuente con voltaje constante, usualmente asociado a su conexión con un gran sistema eléctrica de potencia o por la autoregulación de voltaje de una fuente. En la otra gráfica, el flujo de potencia eléctrica producido por esa la diferencia de voltaje respectiva. Hecho en MATLAB, con generación de números aleatorios, para lo que vengo investigando que con las DC Microgrids.
Dr. Jorge Luis Mírez Tarrillo – PERU
Facebook http://www.facebook.com/jorgemirezperu
Linkedin https://www.linkedin.com/in/jorge-luis-mirez-tarrillo-94918423/
Scopus ID: https://www.scopus.com/authid/detail.uri?authorId=56488109800
Google Scholar: https://scholar.google.com/citations?user=_dSpp4YAAAAJ
E-mail: jmirez@uni.edu.pe
Estimados lectores, y resulta que una de las cosas más interesantes es acercarse hacia las condiciones reales de velocidad de viento y de potencia, sea para la valorización energética sino para también probar los sistemas de respaldo y de control ante escenarios recreados en computadora. La gráfica desarrollado muestra las variaciones de velocidad de viento y de potencia. Hecho en MATLAB, en el que detrás hay obviamente matemáticos con generación de números aleatorios entre 4 m/s a 15 m/s., Sólo está contemplado una turbina con densidad de aire y coeficiente de potencia constante, pero se puede recrear escenarios más reales. Bienvenido el apoyo y colaboración para seguir investigando y publicando.

Dr. Jorge Luis Mírez Tarrillo – PERU
Facebook http://www.facebook.com/jorgemirezperu
Linkedin https://www.linkedin.com/in/jorge-luis-mirez-tarrillo-94918423/
Scopus ID: https://www.scopus.com/authid/detail.uri?authorId=56488109800
Google Scholar: https://scholar.google.com/citations?user=_dSpp4YAAAAJ
E-mail: jmirez@uni.edu.pe
Estimados lectores, lo que considero relevante es al admirar el plano es ver que el punto que marca la potencia ideal de una turbina eólica realizaría una trayectoria sobre esa superficie que en éste caso toma constante el valor de la densidad y del coeficiente de potencia. Hecho en MATLAB. Bienvenido todo apoyo y colaboración para continuar investigando.

Dr. Jorge Luis Mírez Tarrillo – PERU
Facebook http://www.facebook.com/jorgemirezperu
Linkedin https://www.linkedin.com/in/jorge-luis-mirez-tarrillo-94918423/
Scopus ID: https://www.scopus.com/authid/detail.uri?authorId=56488109800
Google Scholar: https://scholar.google.com/citations?user=_dSpp4YAAAAJ
E-mail: jmirez@uni.edu.pe
Todo artefacto, componente, máquina, sistema, etc… presenta un progresivo envejecimiento que conlleva a la falla de los equipos los cuales se van registrando durante los años de funcionamiento y con esa información se crea histogramas como el que se muestra en el presente post. Obviamente mientras más fallas se presentan la curva de distribución se forma mejor, y a partir de ello se puede normalizar y tener una función de probabilidad característica de la marca y modelo del equipo, máquina, etc. Elaborado con MATLAB para ustedes queda la gráfica.

Dr. Jorge Luis Mírez Tarrillo – PERU
Facebook http://www.facebook.com/jorgemirezperu
Linkedin https://www.linkedin.com/in/jorge-luis-mirez-tarrillo-94918423/
Scopus ID: https://www.scopus.com/authid/detail.uri?authorId=56488109800
Google Scholar: https://scholar.google.com/citations?user=_dSpp4YAAAAJ
E-mail: jmirez@uni.edu.pe
Es grato el recibir este Reconocimiento que conlleva a renovar el compromiso con la ciencia y tecnología del Perú y de la humanidad. Resultado que es reflejo del trabajo en conjunto y apoyo de familiares, colegas, estudiantes y amigos. Esperemos sacar más productos de investigación, bienvenido sea el trabajo y la colaboración académica/científica.

Dr. Jorge Luis Mírez Tarrillo – PERU
Facebook http://www.facebook.com/jorgemirezperu
Linkedin https://www.linkedin.com/in/jorge-luis-mirez-tarrillo-94918423/
Scopus ID: https://www.scopus.com/authid/detail.uri?authorId=56488109800
Google Scholar: https://scholar.google.com/citations?user=_dSpp4YAAAAJ
E-mail: jmirez@uni.edu.pe
Invitación a participar del Webinar: Microrredes Eléctricas. Expositor: Dr. Jorge Mírez. Jueves 30 de Marzo 2023. Hora: 16:00 horas México (17:00 horas Lima)
Link de Registro Expo Energía México 2023:
https://www.expoenergia.com.mx/Webinar/index.php

Link de Paper en IEEExplore:
https://ieeexplore.ieee.org/document/9359432
DOI: 10.1109/ICMEAE51770.2020.00043
Abstract:
Structure perovskite cells, with the general formula ABX3 and named after the mineral CaTiO3 [1], become good candidates for use in converting solar energy into electrical energy, because their efficiency increased in a short period from an initial 3.8 % to laboratory-scale energy conversion efficiency of 23.3 %, which rivals the performance of commercial multi-crystalline silicon solar cells [2]. Recently the power conversion efficiency (PCE) has reached 24.2 %. In addition, another important merit is its production cost, screen printing [3], roll to roll printing [4]. Another characteristic of the carbon electrode is that, due to its composition, it can transport the holes and does not need a hole-transporter material (HTM) or hole-transporter layer (HTL), unlike peroskite cells with metal. In [19] a study is reported where the storage stability of 1 year and PCE of 10.4 % (AM 1.5G, 100 mW/cm was reached in an area of 49 cm2 of mesoscopic carbon perovskites (CSPC).
Regards:
Dr. Jorge Luis Mírez Tarrillo – PERU
Facebook http://www.facebook.com/jorgemirezperu
Linkedin https://www.linkedin.com/in/jorge-luis-mirez-tarrillo-94918423/
E-mail: jmirez@uni.edu.pe
Link in IEEExplore: https://ieeexplore.ieee.org/document/9140175
DOI: 10.1109/ICMEAE.2019.00034
Abstract:
This article includes a compilation and analysis of relevant information on the state of the art of the implementation of the Droop Control technique in microgrids. To this end, a summary and compilation of the theoretical models of the Droop Control and a summary of implementations have been made and, in general, try to summarize the great variety of experiences developed in this topic. The chosen experiences have been selected according to the research motivations that are available in the future and that are explained throughout this article, since this will serve as a starting point and guide for future research in microgrids and similar novel topics such as Low Voltage Distribution in Direct Current (LV DC) and DC microgrids (DC MG). The LV DC distribution for this article is related to houses in direct current (DC Home).
Gratefully for this news !!
Regards:
Dr. Jorge Luis Mírez Tarrillo – PERU
Facebook http://www.facebook.com/jorgemirezperu
Linkedin https://www.linkedin.com/in/jorge-luis-mirez-tarrillo-94918423/
E-mail: jmirez@uni.edu.pe
Determining the necessary area of photovoltaic solar panels to be able to feed a demand is something to evaluate considering that both the demand and the energy source (the Sun) vary in their behavior. The total solar cells area required to supply the load demand can be calculated from the following equation shown in the figure of this post where \F_{s} is the safety factor which includes the possible allowance of insolation data inaccuracy, \V_{F} is the factor of variability which considers the impact of yearly radiation variation. \P_{L} is the power demand, \H_{t} is the solar irradiation and \n_{c} is the efficiency of the photovoltaic solar panel.

Dr. Jorge Luis Mírez Tarrillo – PERU
Facebook http://www.facebook.com/jorgemirezperu
Linkedin https://www.linkedin.com/in/jorge-luis-mirez-tarrillo-94918423/
Scopus ID: https://www.scopus.com/authid/detail.uri?authorId=56488109800
Google Scholar: https://scholar.google.com/citations?user=_dSpp4YAAAAJ
E-mail: jmirez@uni.edu.pe
Good morning readers, solar energy is an interesting topic and knowing how efficient its capture is interesting to model and simulate. The hourly generating efficiency of the PV system (calculated in percentage) can be obtained in terms of the cell temperature as shown in the following equation shown in the figure of this post, where \beta_{t} is the temperature coefficient, μcr and \T_{cr} are the theoretical solar cell efficiency and temperature at solar radiation flux of 1000 W/m2, respectively, \lambda is the Ross coefficient, \T_{a} is the ambient temperature and \H_{t} is the solar radiation on tilted surface. Note: All the simulation images in this blog have been developed in Matlab/Simulink, the codes are for sale, as well as the thesis and research advisory service. Best regards.

Dr. Jorge Luis Mírez Tarrillo – PERU
Facebook http://www.facebook.com/jorgemirezperu
Linkedin https://www.linkedin.com/in/jorge-luis-mirez-tarrillo-94918423/
Scopus ID: https://www.scopus.com/authid/detail.uri?authorId=56488109800
Google Scholar: https://scholar.google.com/citations?user=_dSpp4YAAAAJ
E-mail: jmirez@uni.edu.pe
This post has to do with programming and simulating the power curve of a wind turbine and for example I have considered a capacity of 10 MW, with a starting speed of 3 m/s, a nominal speed of 10 m/s and a cutting speed of 25 m/s approx. The output power of wind turbine is described in terms of wind speed from the typical power curve characteristics of the windturbine as it is show in figure of the present post, where, Pw is the wind turbine output power, Pr is the rated output power of WT, u_c is the cut-in wind speed, u_r is the rated wind speed, and u_f is the cut-off wind speed.

Dr. Jorge Luis Mírez Tarrillo – PERU
Facebook http://www.facebook.com/jorgemirezperu
Linkedin https://www.linkedin.com/in/jorge-luis-mirez-tarrillo-94918423/
Scopus ID: https://www.scopus.com/authid/detail.uri?authorId=56488109800
Google Scholar: https://scholar.google.com/citations?user=_dSpp4YAAAAJ
E-mail: jmirez@uni.edu.pe
Blog in ENGLISH

Compra/Buy – Haz una donación/Make a donation

Dear reader, if you wish to make a donation or are interested in any information or code, please contact me (e-mail: jmirez@uni.edu.pe). Donations will allow you to continue studying and researching, and also to provide more information on this blog. My PayPal account is jorgemirez2002@gmail.com or if it is by bank transfer write to my email jmirez@uni.edu.pe. Any amount of money is welcome. Thank you.
Estimado lector, si desean hacer una donación o le interesa alguna información o código, favor ponerse en contacto con mi persona (e-mail: jmirez@uni.edu.pe). Las donaciones va a permitir seguir estudiando e investigando, y además, el poder brindar más información en este blog. Mi cuenta en PayPal es jorgemirez2002@gmail.com o si es por transferencia bancaria escribirme a mi correo jmirez@uni.edu.pe. Cualquier cantidad de dinero es bienvenido. Gracias.
Datos Generales
Good day. My full name is Jorge Luis MIREZ TARRILLO.
I am Peruvian and live in Lima, capital of Perú in South America.I am Mechanical Electrical Engineering, MSc Physics and Dr. Physics (title doctoral thesis: Control, Optimization, and Management of Microgrid Current Direct)
Too, actually job as Principal Professor in Faculty of Oil, Gas and Petrochemical Engineering of Universidad Nacional de Ingeniería (National University of Engineering) in Lima – PERU (Courses: Modern Physics, Differential Equations and Research's Methodology)
My subjects of my interest are control, signal processing, optimization, simulation, biomedical research, smart grid, microgrid, water.
I have experience in Matlab/Simulink programming, biomedical equipment, electrical systems, renewable energies, microgrids, saturated steam systems 100 psi and organizing academic events.
Comentarios Recientes
Elementos que compon… en J506: Los elementos de un paqu… Dr. Jorge Mírez en Message by IEEE Community Dr. Jorge Mírez en J546: Simulación de campos mag… jose luis huayanay v… en Message by IEEE Community Cesar Aviles en J546: Simulación de campos mag… Dr. Jorge Mírez en J518: La herramienta pdetool d… Dr. Jorge Mírez en J496: Simulación en Matlab/Sim… Raúl Barrios Elizarr… en J496: Simulación en Matlab/Sim… jose luis huayanay v… en J518: La herramienta pdetool d… MSc. Jorge Mírez en J281: La Rosa de Vientos: Frec…

Debe estar conectado para enviar un comentario.